One of our Micronaut application started to fail to respond to the predefined route. We were getting one of the well-known errors which…
How to Debug CORS Issues with Chrome and IntelliJ IDEA
One of our Micronaut application started to fail to respond to the predefined route. We were getting one of the well-known errors which signalise that there’s and CORS issue:
Access to XMLHttpRequest at ‘https://backend.local:9997/upload’ from origin ‘https://frontend.local:8100’ has been blocked by CORS policy: Response to preflight request doesn’t pass access control check: No ‘Access-Control-Allow-Origin’ header is present on the requested resource.
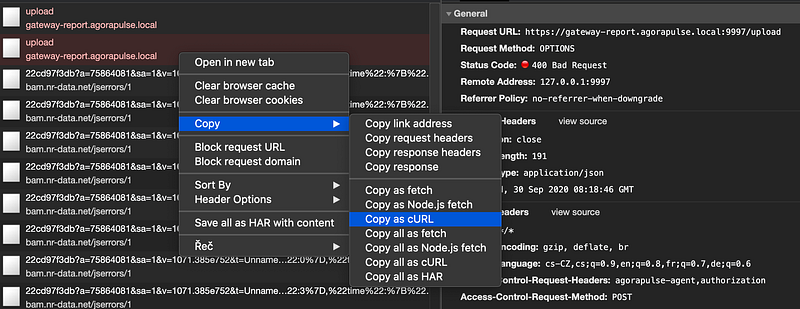
Be sure you are using the latest version of Chrome because between versions 79 to 83 the CORS preflight requests were not visible by default. Once you identify the failing OPTIONS request then you can copy it as acURL command. Beware that OPTIONS requests are not considered XHR request so be sure you don’t have any filter in the Network tab enabled.
Then you can open IntelliJ IDEA and create a new HTTP scratch file (the simplest way is to tap ⇧ Shift key twice and write “scratch file” inside the popup dialog).
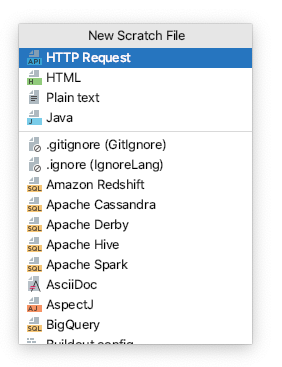
Then you can simply paste the cURL request inside the new scratch file:

The green “play” button on the right-hand side of the view allows you to run exactly the same request as the one which was performed by Chrome which
- may save you some unnecessary steps you would have to walk through in the frontend
- show you the response body which is ignored by Chrome
In our case, we were getting a duplicate route exception error message in the response body.
{
“message”: “More than 1 route matched the incoming request. The following routes matched /upload: OPTIONS - /upload, OPTIONS - /upload”,
“_links”: {
“self”: {
“href”: “/upload”,
“templated”: false
}
}
}
As soon as we know what was actually wrong it was quite easy to fix it.